Thinking Differently
From rows and columns to nodes and edges
"Human beings do not live in the objective world alone, nor alone in the world of social activity as ordinarily understood, but are very much at the mercy of the particular language which has become the medium of expression for their society."
- Edward Sapir, The Status of Linguistics as a Science (1929)
In the movie Arrival, there is a scene where the protagonist, a linguist trying to decode the writings of aliens, is confronted by her partner, who references the Sapir-Whorf hypothesis. “Are you dreaming in their language?” he asks.
The Sapir-Whorf hypothesis postulates that the language a person speaks shapes the way they think and how they perceive the world. Language, in this sense, limits one’s ability to understand things.
But therein lies an opportunity. If language is limiting, learning new languages can unlock new ways of seeing and engaging with the world.
This post argues that supervisors should learn the language of knowledge graphs — i.e., of nodes and edges — to see the world distinct from the rows and columns that have enabled and shaped our understanding of the financial system.
The language of banking and finance
Banking and finance is communicated through tables and spareadsheets. Ledgers, balance sheets, income statements, risk reports, databases — all are organized in tabular rows and columns.
Tables are extremely useful. They provide organization and structure. They enable comparison and analysis. Bankers and markets would be lost without tabular data. Supervisors, too. Nearly everything supervisors do feeds into a table.
Rows and columns thinking drives supervisory question and answers.
During financial crises, spreadsheets dominate. Rows and columns thinking drives supervisory questions and actions — e.g., “What are banks’ exposures to X?” Filling in tables becomes imperative.
During the 2008 Global Financial Crisis (GFC), I recall working on the first liquidity risk report with the New York Fed. Each row featured a different funding source: deposits, commercial paper, Treasury repo, agency repo, etc. Each column featured a different maturity: overnight, 1 day, 2 day, 1 week, 1 month, etc. The table captured the reporting bank’s funding amounts by type and maturity. Prior to the development of that “1G” spreadsheet, the U.S. authorities did not have real line of sight into the funding risk profiles of the major U.S. financial institutions.
The same happened with global banks’ counterparty credit risk exposures (e.g., to AIG) and capital exposures to stress (e.g., SCAP). These gaps and uncertainties were addressed with spreadsheets and data in tabular form.
The limits of rows and columns
The utility and ease of data tables elides their limits, though.
The “1G” liquidity report went through rapid iterations and expansions. More rows were needed for more types of funding instruments. More columns were needed for more maturity buckets. Additional tabs were needed for legal entities and for currencies. 1G evolved into 2G then 3G.
This data, now captured via a 6G report formally called the 2052a, is extremely valuable to regulators, especially during times of market stress. (I can personally attest to this.)
Despite its scope and granularity, however, regulators cannot use 2052a data to trace funding dependencies and chains between banks and nonbank funding counterparties. It cannot answer the question: How might funding stress at Bank A or at nonbank institution X spread to other banks and NBFIs?
After the GFC, macroeconomists attempted to use tabular data to map the interconnectedness of banks and NBFIs. See, for instance, the FSB’s shadow banking templates:
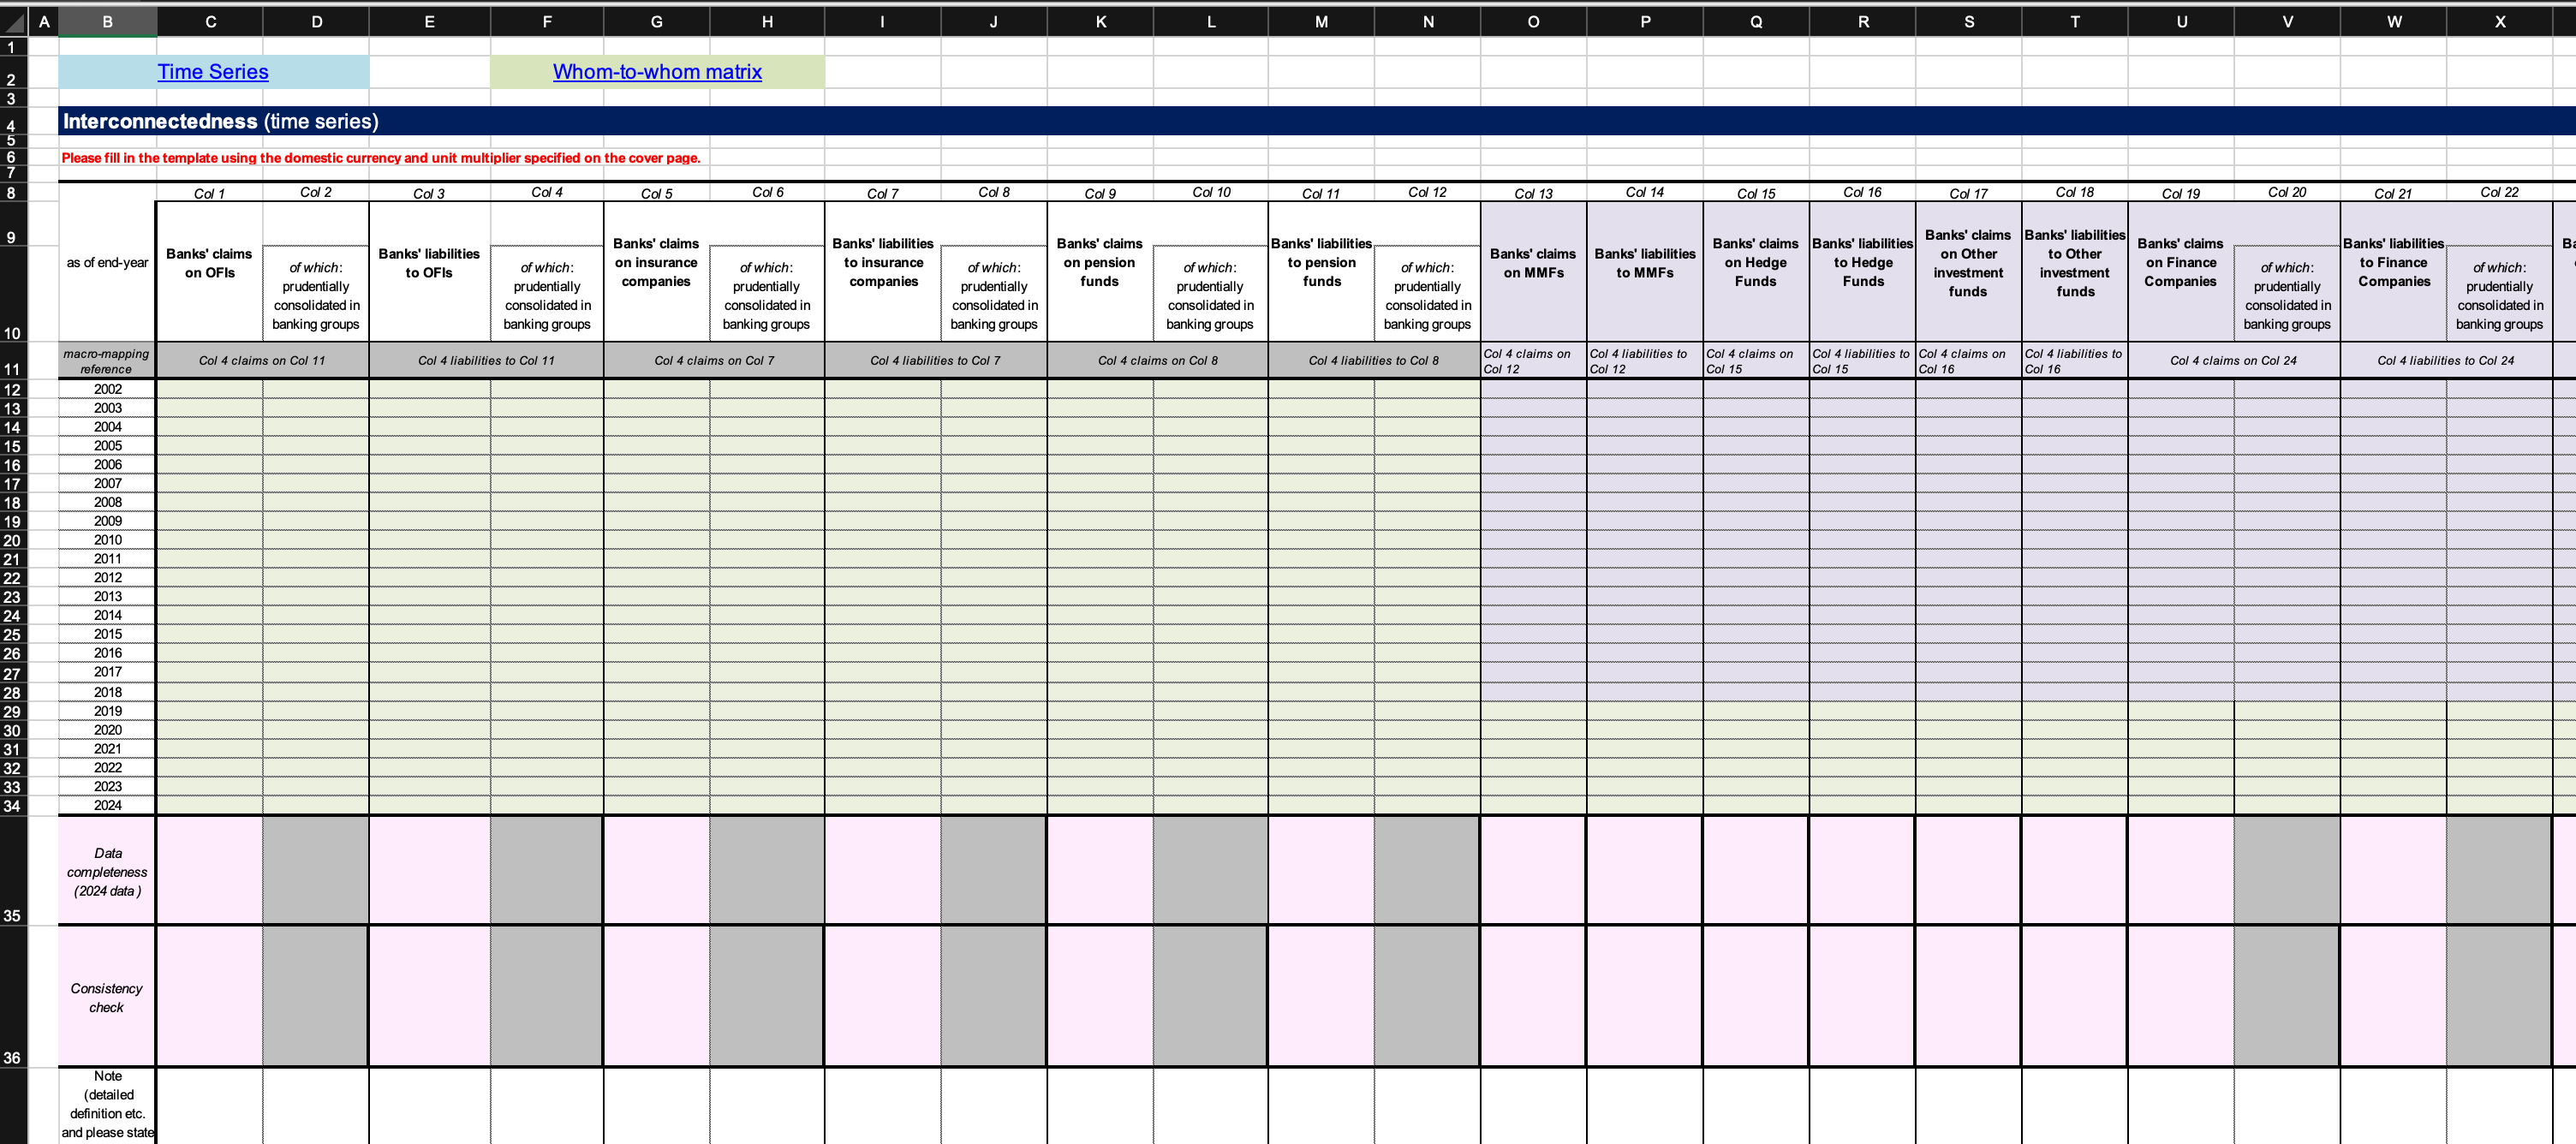
While these tables can provide slightly improved insight into direct exposures between institutions of interest (“one hop”), they aren’t architected to see systems and they struggle to identify chains and pathways (“multi-hop”).
Nodes and edges: A different language and way of thinking
In contrast to tabular data, knowledge graphs are relational by design. Instead of rows and columns, graph structures consist of nodes (entities) and edges (relationships between entities). For instance, a bank may be a node, a borrower another node, and the loan between them an edge.
In a table, each row is an island. A row in a loan portfolio report might tell you the borrower, the margin, the balance, the maturity. But the row doesn’t know about the other rows. It doesn’t know that the same borrower also has a credit line at another bank, or that the borrower’s largest customer is itself highly leveraged, or that the collateral backing the loan is also pledged elsewhere. To discover these things in a tabular world, you need another table, and then another, and an analyst to stitch them all together.
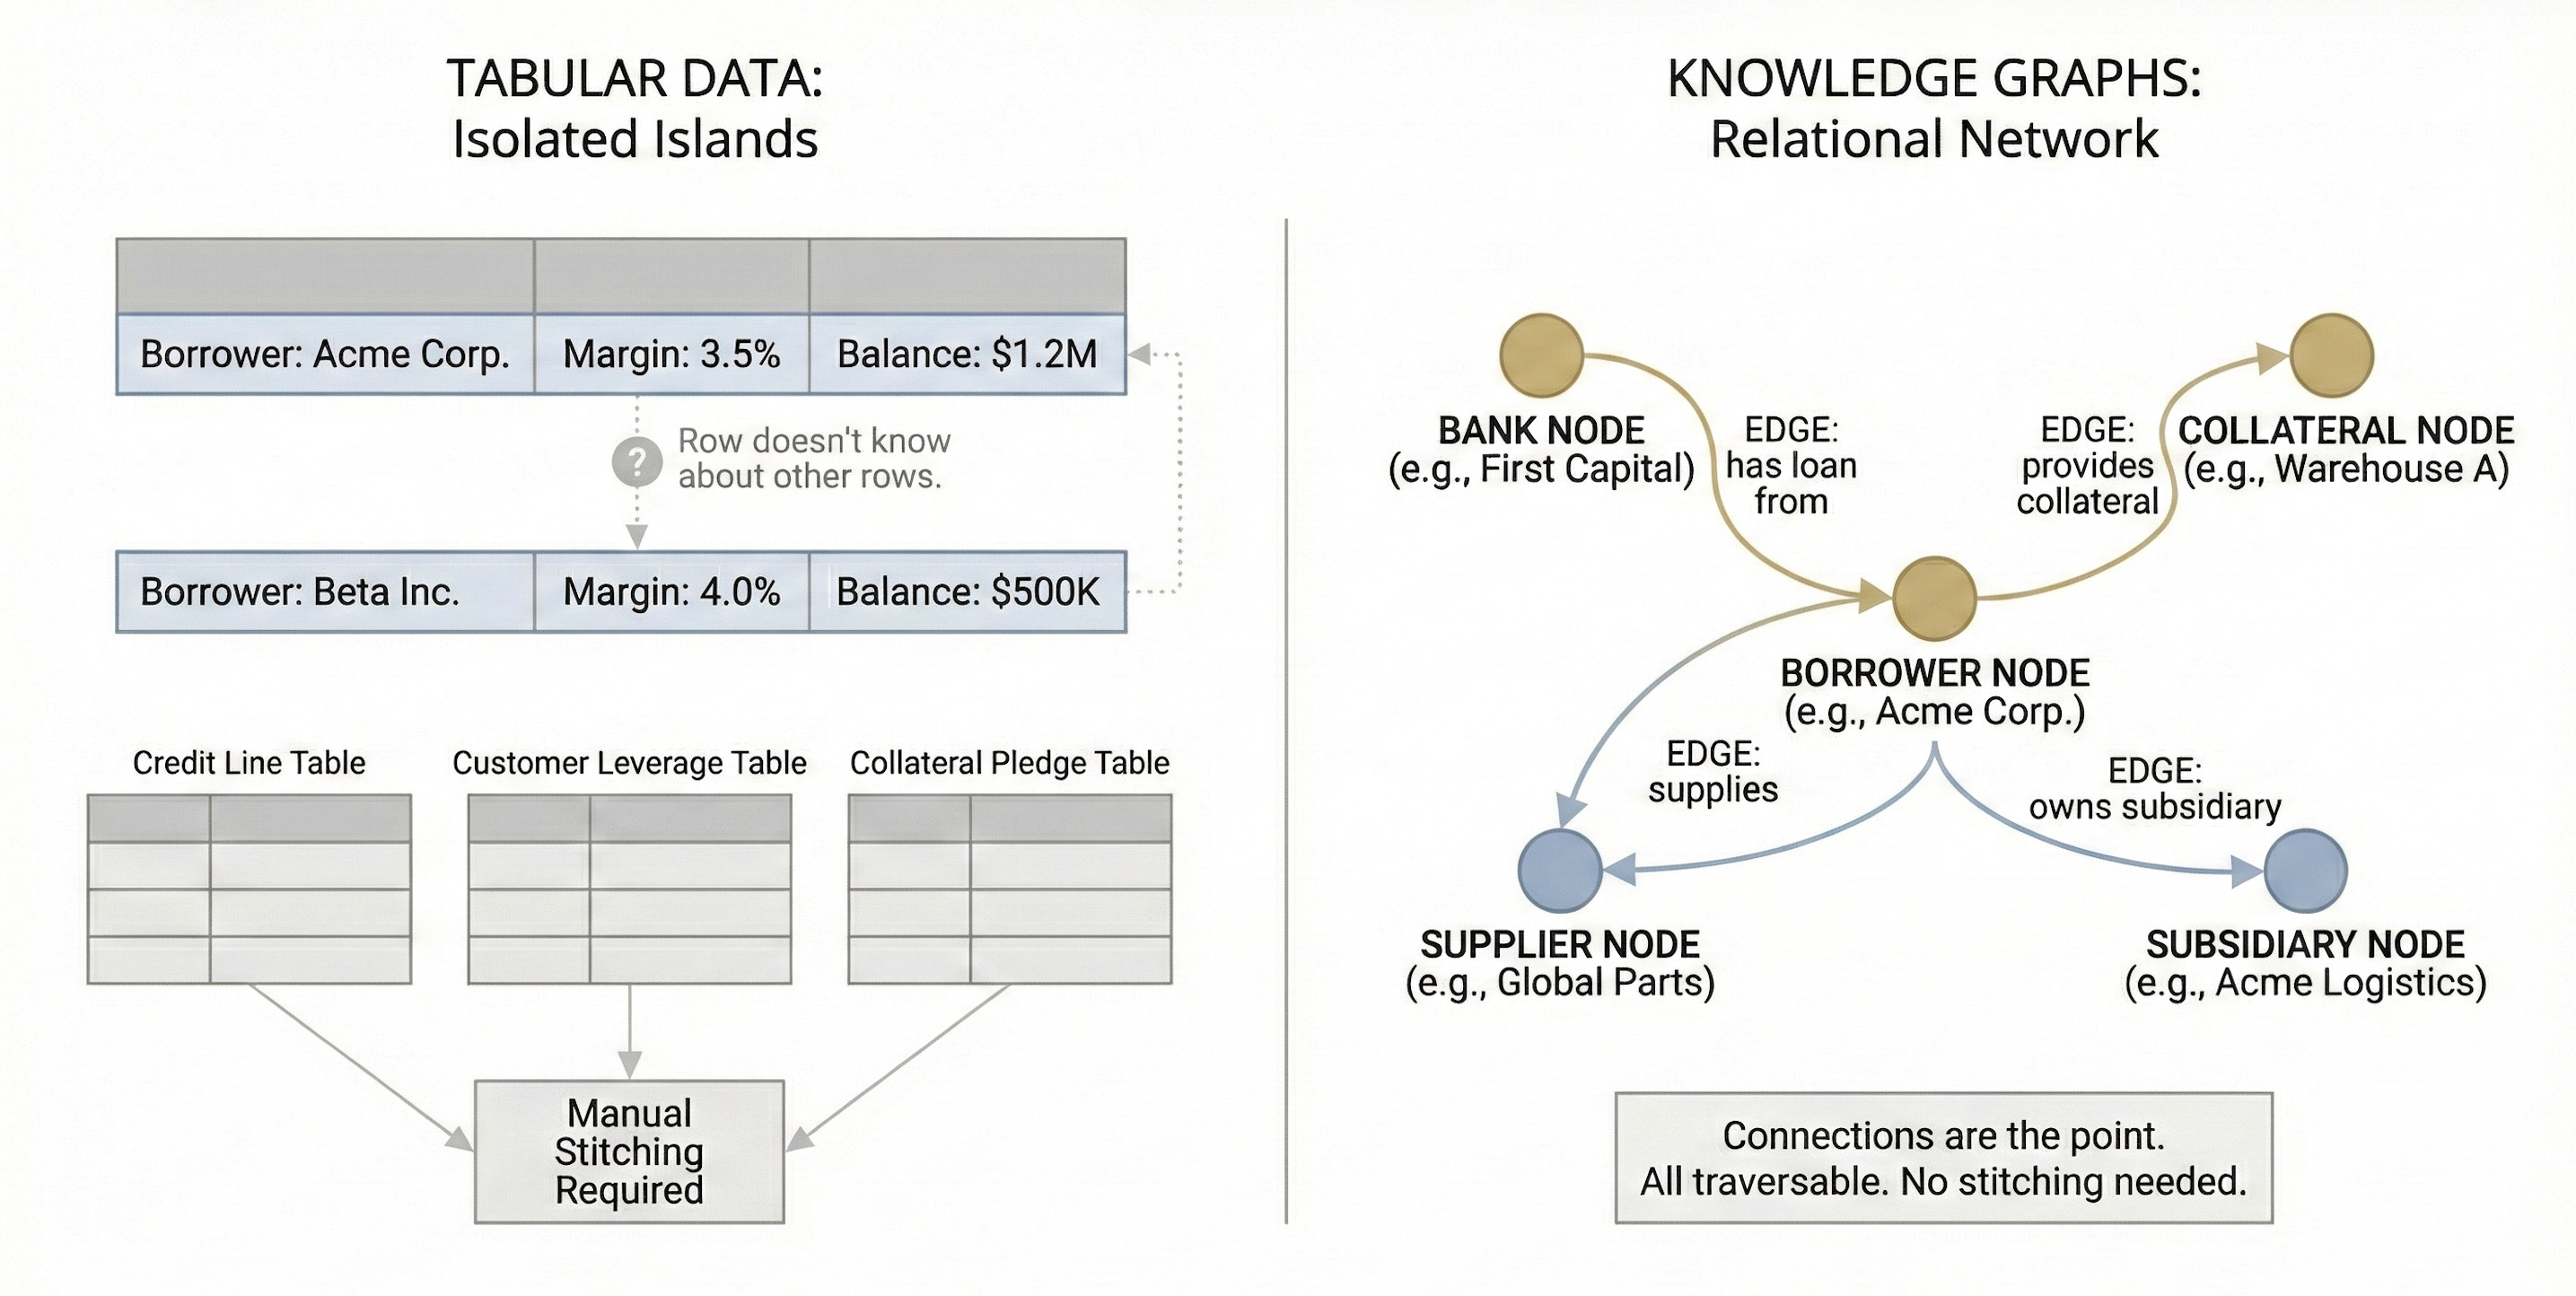
In a knowledge graph, there are no islands — everything is relational. Each node exists in relation to other nodes. Edges capture the nature of their relationships and the node-and-edge structure makes it easy to trace chains of interconnectivity. A borrower node will connect to lender nodes, collateral nodes, supplier nodes, and subsidiary nodes — all at once, all traversable. There’s no need to create new tables and have an analyst stitch them together. The graph structure does all of that work natively.
In Cypher, a popular graph language by Neo4j, nodes and edges are represented in a particular syntax, i.e., (Node) - [Relationship] - (Node). In the example above, the bank and borrower nodes and the loan edge would be recorded as:
CREATE (b:Borrower {name: “Acme Corp.”, margin: “3.5%”, balance: “1.2M”})
CREATE (bk:Bank {name: “First Capital”})
CREATE (b)-[:HAS_LOAN_FROM {maturity: “2028”}]->(bk)
This is quite different from a spreadsheet and will be daunting to tabular natives (like me). Many reading this are likely asking themselves: Is it really worth it to learn this language? How much of a difference could it actually make?
Backtest example: Shadow Banking circa 2006-2008
One way to answer that question is to backtest the tabular versus graph view of the financial system in the lead up to the 2008 GFC.
Prior to the 2008 GFC, supervisors’ understanding of the shadow banking system was extremely limited. International regulatory attention was focused on banks’ exposures to RMBS equity tranches and to hedge funds with favorable margin terms. As structured finance grew rapidly, regulators turned their focus to CDOs and monolines - again, though, through the tabular lens of exposures.
Regulators’ understanding of the interconnected nature of the banking and shadow banking system didn’t really cohere until Ashcraft, Pozsar et al. were able to capture it in their paper Shadow Banking. Their summary diagram, depicted below, consists of over one hundred T accounts (tables!) of various funding vehicles, connected in various ways — almost a proto-nodes and edges view. (The diagram had to be blown up to a 4 x 6 foot poster in order to be readable.)
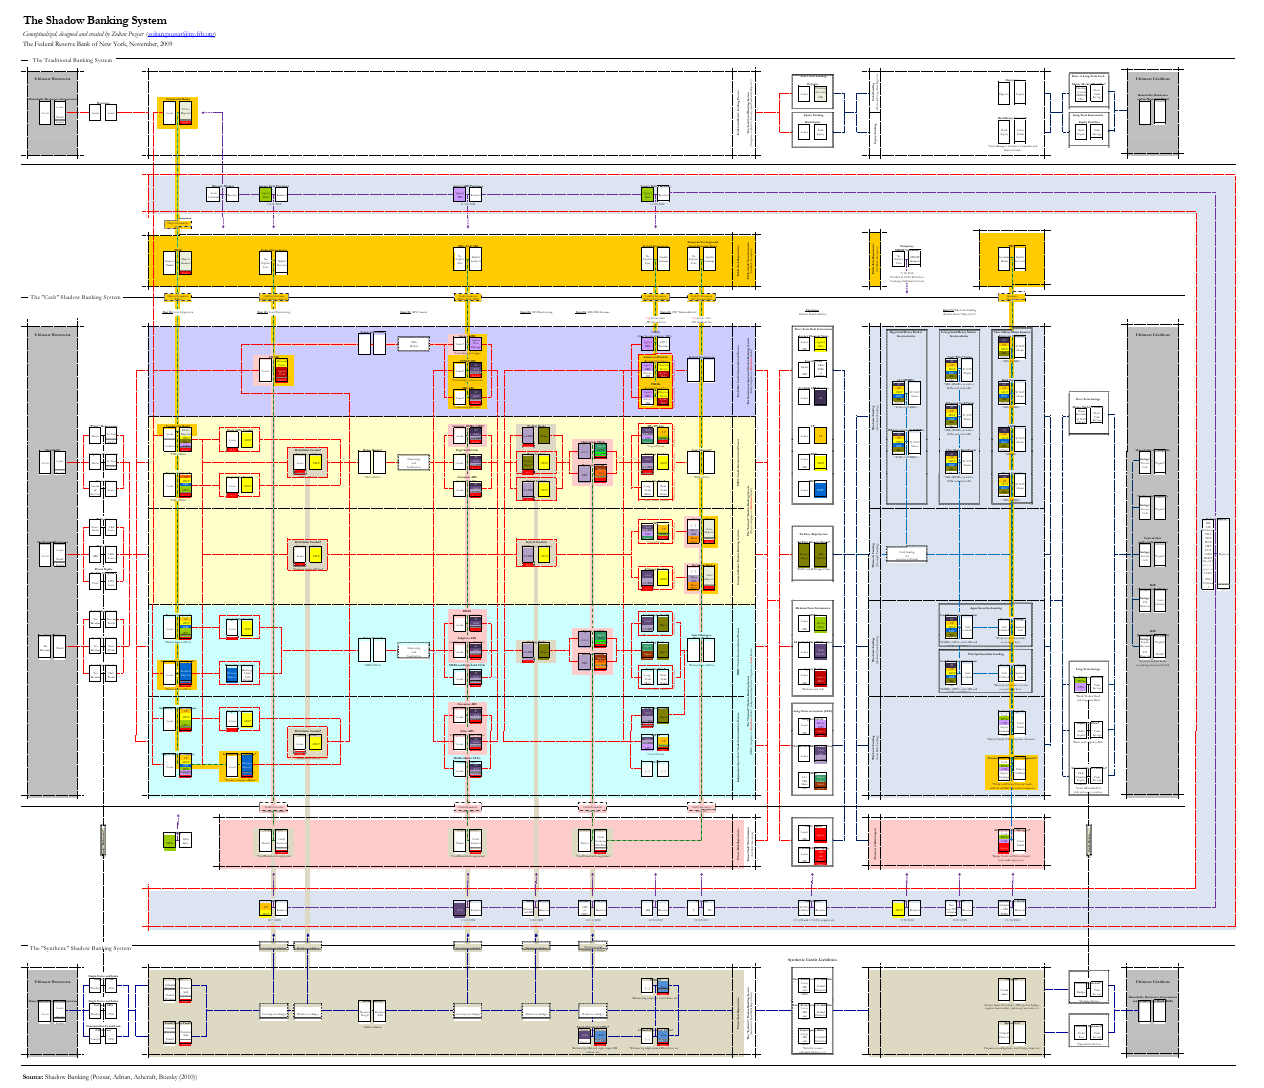
To approximate what a true nodes-and-edges view of the financial system may have looked like at the time, I asked Claude Opus 4.6 to create a knowledge graph reconstruction of the Ashcraft, Pozsar et al diagram. The result, available here, is intuitive, interactive, and can be filtered along multiple dimensions, as shown in this short video:
Through this lens, the complexity of the interconnectedness of the nodes jumps out immediately. It invites different kinds of questions. Through a tabular lens, the motivating question is, “How much exposure does X have to Y?” The goal is to fill out the table. Once it is filled out, one is done.
Through a graph lens, the motivating question is, “How are X and Y related?” The goal is to understand relationships, including transitive and intertwined relationships (X to Y, Y to Z and A, etc.). One cannot be done until one identifies all nodes and maps all relationships between them.
Mapping relationships pre-GFC would have allowed regulators to “follow the money” more easily — to see how growing investment in money market funds was driving the growth of SIVs and conduits, which provided steady demand for CDOs and creative financial engineering. Rather than getting hung up trying to measure one-hop exposures, we would have spent more time uncovering the interconnectedness of the shadow banking system before it blew up.
Supervisory example: First Day Letters
Another way to think about the potential impact of knowledge graph thinking on supervision would be to consider its impact on examinations.
Consider the first day letter (FDL). This is the formal written communication that a supervisory team sends to a bank to kick off an examination. The primary purpose of a first day letter is to request information. It takes the form of a series of questions. These questions typically ask for documents, data, and descriptions of processes, controls, and risk management procedures.
As with rows in tables, each question in a typical FDL is discrete and answerable on its own. For instance, a fairly standard up front question might be, “Describe your governance framework for X,” which may be followed by “Provide relevant policies and procedures.”
Under a nodes-and-edges approach, the same inquiry would be reframed as: “Identify the entities involved in X and how they interact.”
The shift is subtle, but important. The rows-and-columns question elicits artifacts from the bank, inviting the bank to explain its processes as laid out on paper. By contrast, the node-and-edges question elicits structure and flow from the bank, inviting the bank to show how things work in practice.
The former approach begs for a checklist to be filled out. The latter compels understanding.
I believe the challenge of supervisors being overly process-oriented can be traced, in part, to the dominance of rows-and-column thinking, i.e., of filling in the proverbial table. A graph-based approach, by contrast, would put a premium on understanding systems and how their constituent parts interact and are related.
Conclusion
As the protagonist in Arrival becomes more fluent in the alien’s logograms, she gains their non-linear understanding of time and gets glimpses of her future.
Gaining fluency in knowledge graphs will not allow supervisors to see the future like that, but it should enable them to see the financial system more as a system consisting of overlapping networks of relationships, and not just as a series of flattened exposure snapshots.
As the financial system evolves and increases in complexity, especially with the continuing march of digitalization, rise of AI agents, and tokenization of assets, supervisors who are fluent in nodes-and-edges and able to think differently will be better positioned to adapt to and understand the changes taking place.